Lab 4: Characterize Your Car
Click here to return to home page
Key code snippets are on this site, but the complete files can be found on on GitHub
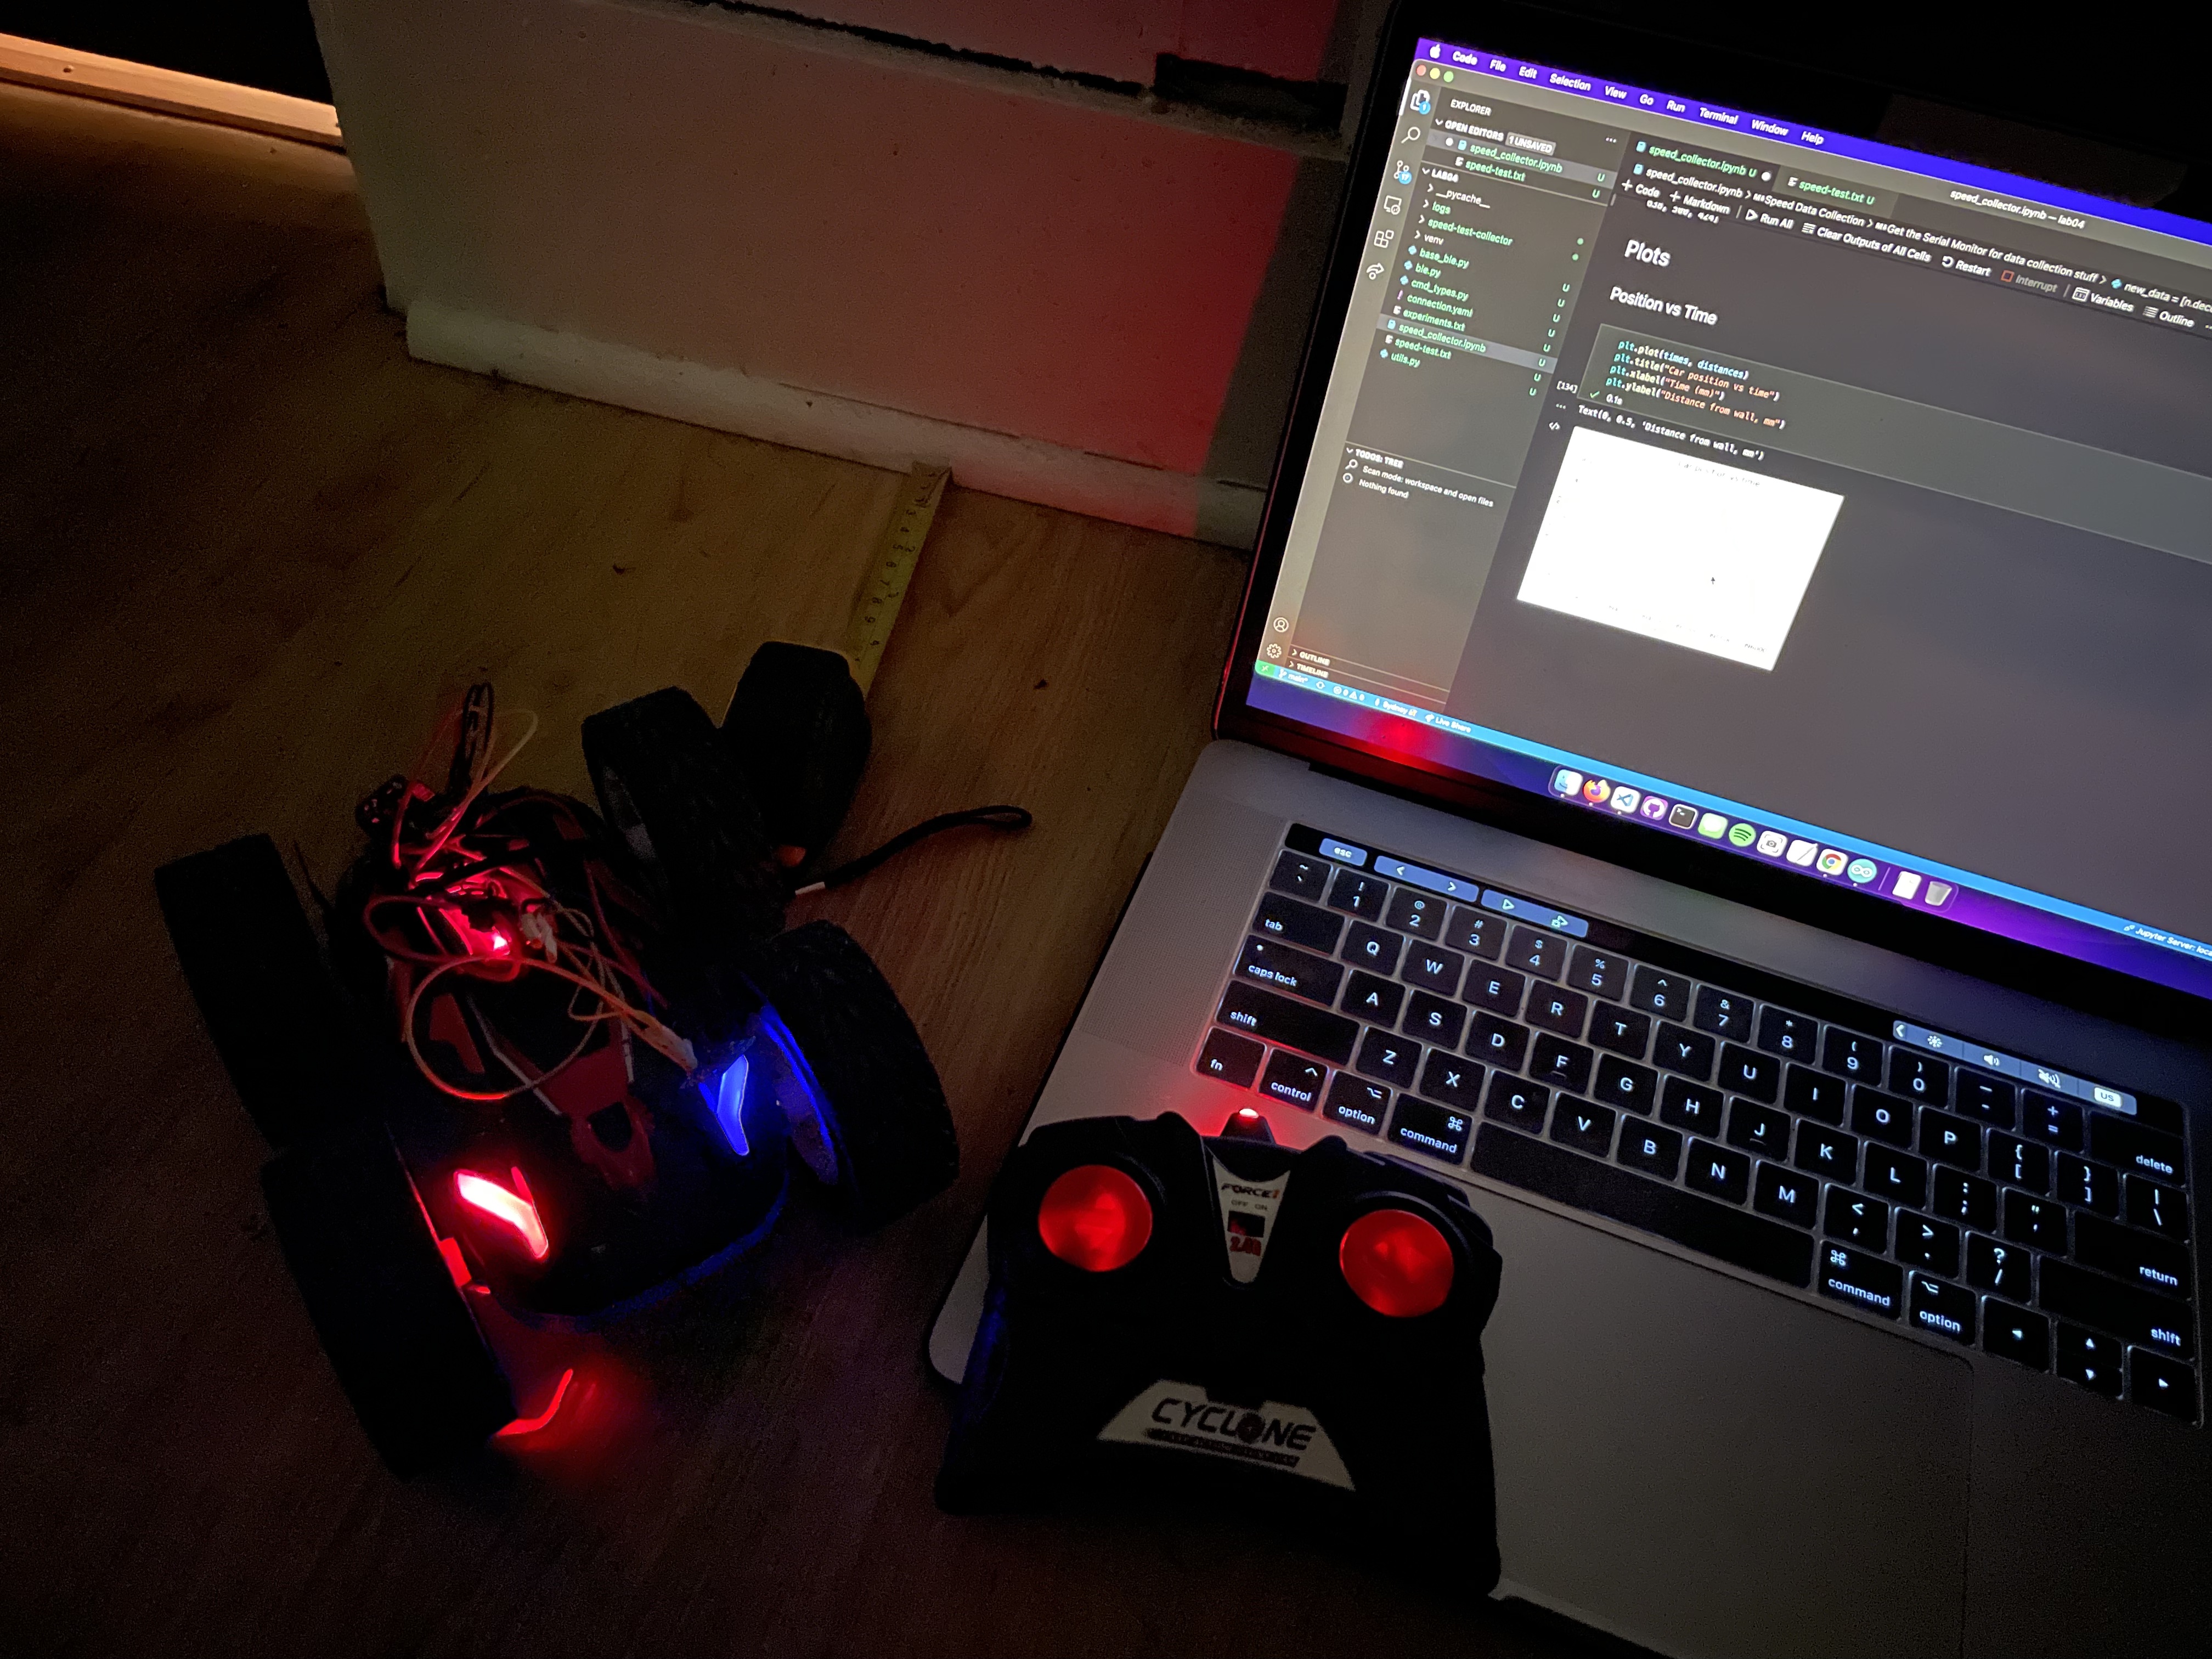
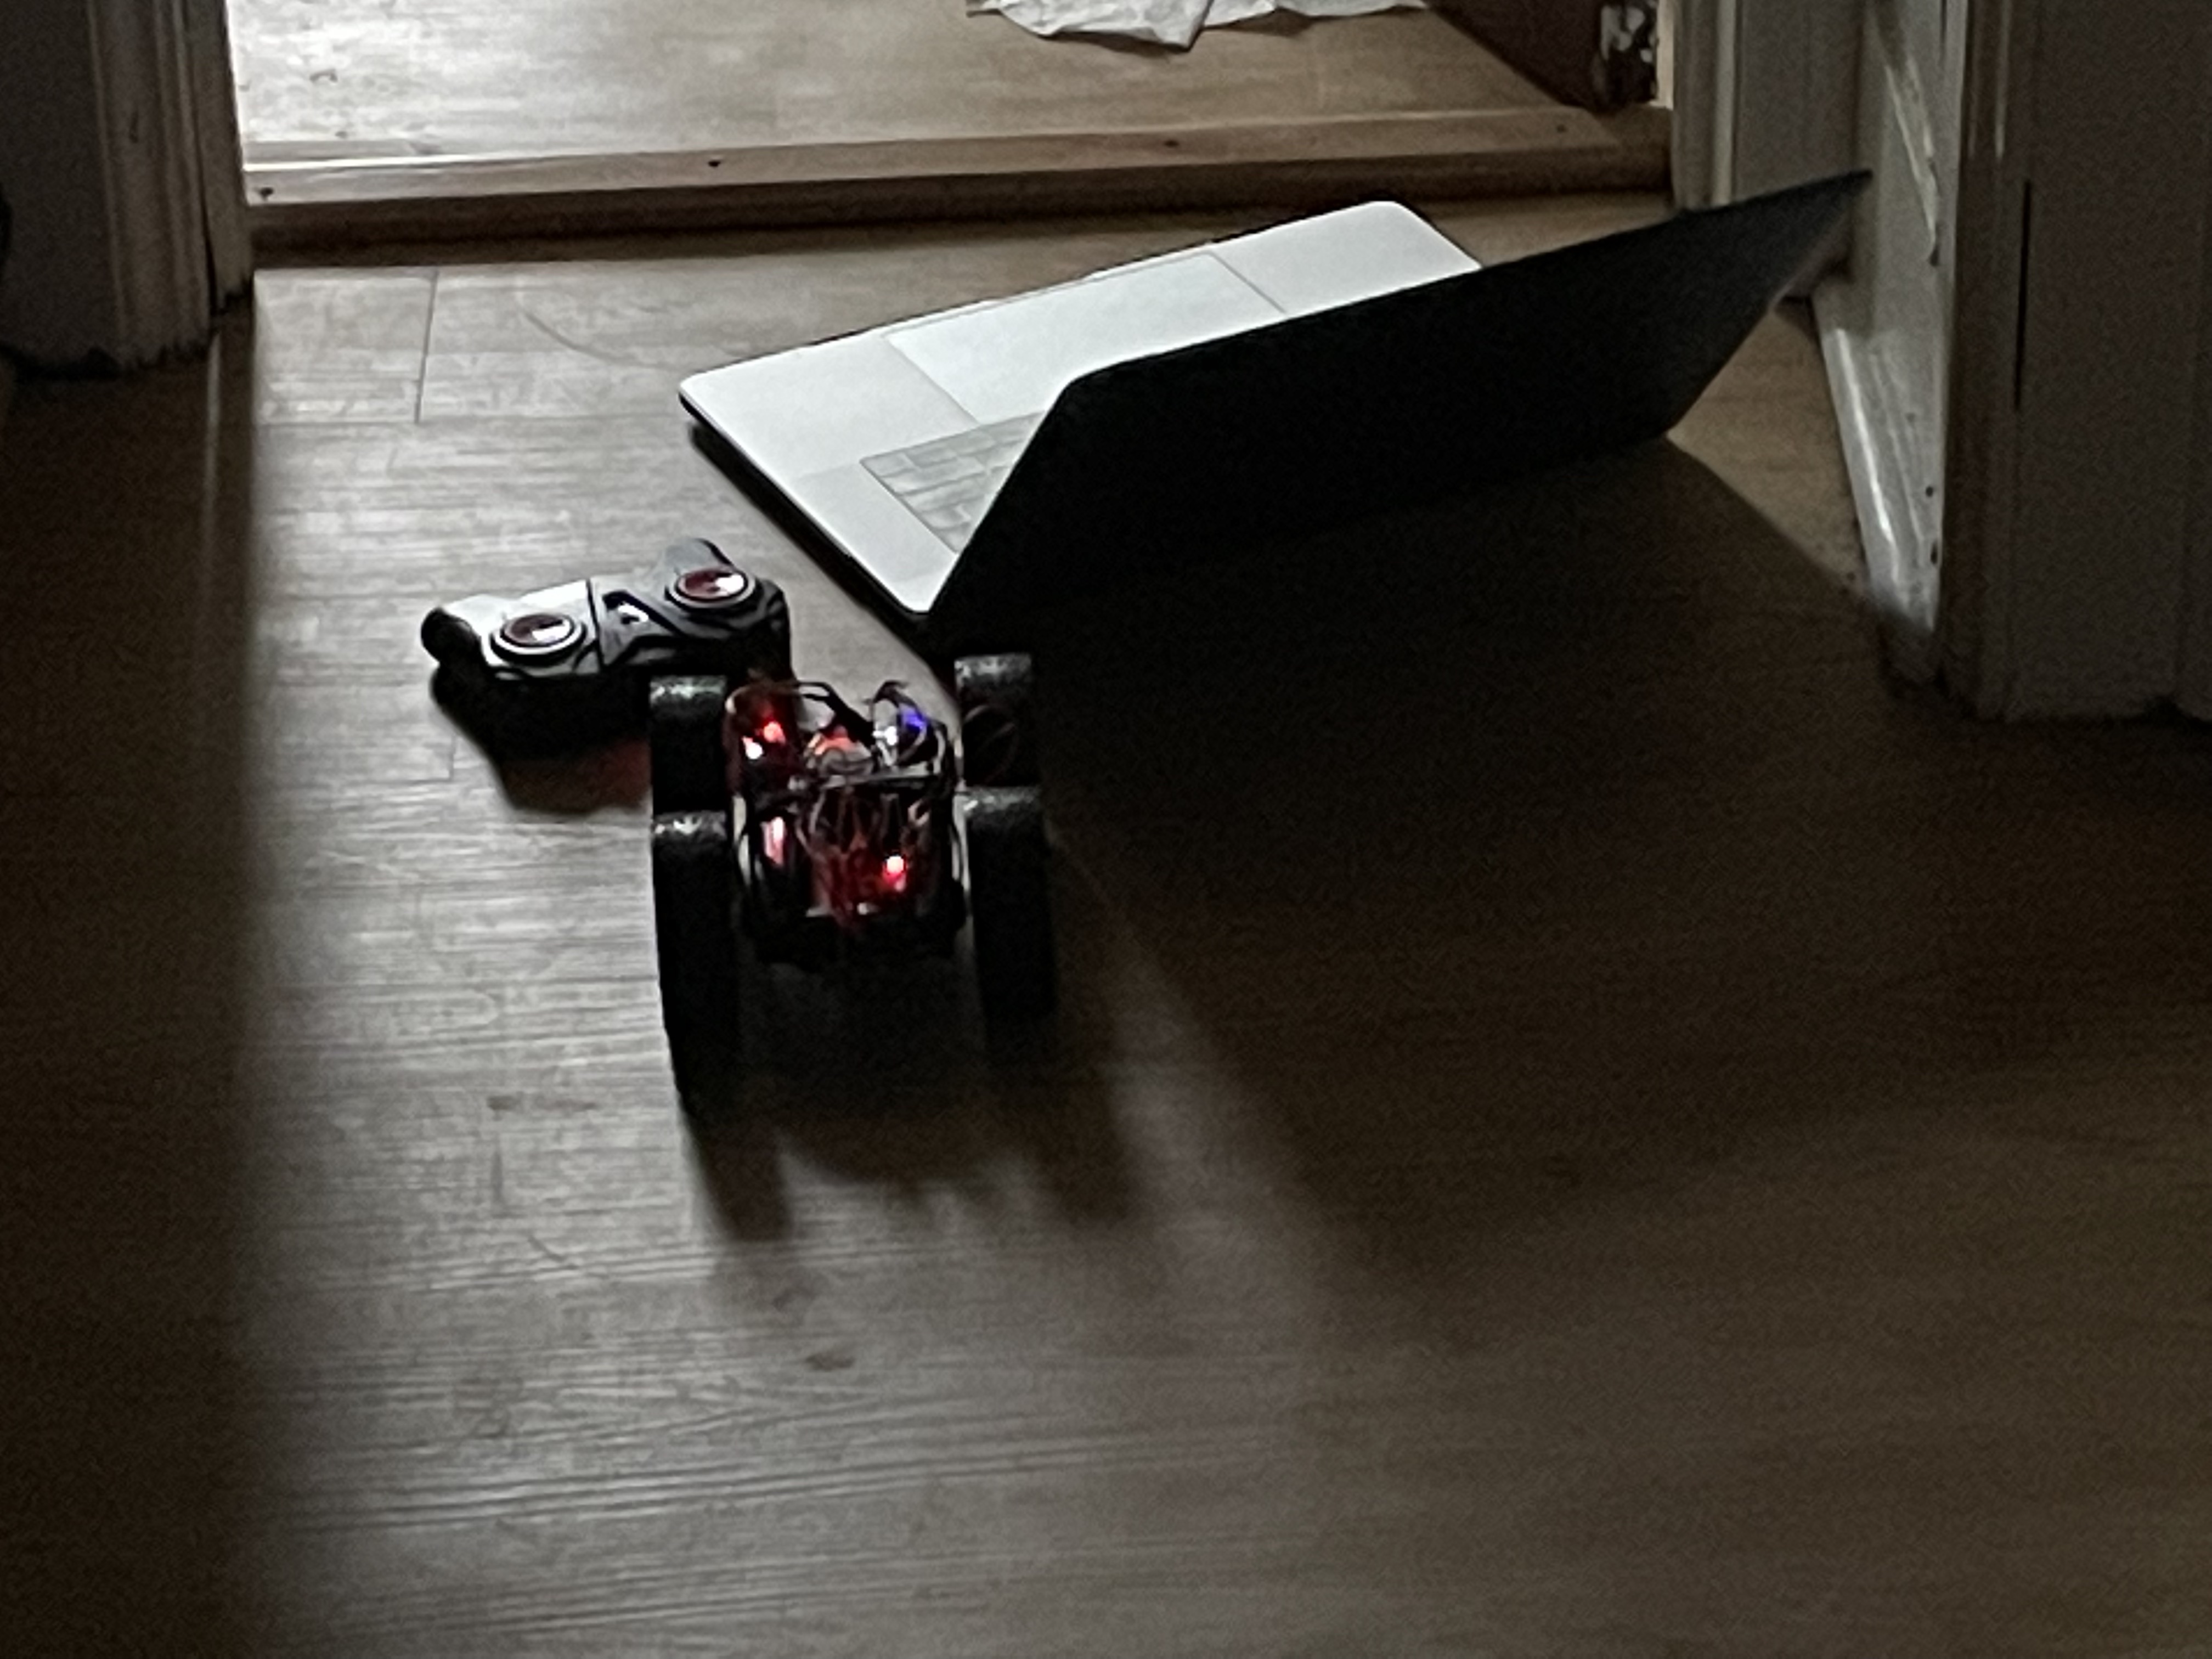
Prelab
The prelab required a small amount of soldering to allow the Artemis battery to be plugged in. This became useful for testing later when I used the ToF sensor.
I also wrote some Arduino code to send ToF data over Bluetooth:
void get_distance(SFEVL53L1X sensor, String sensorName) {
  sensor.startRanging();
  while (!sensor.checkForDataReady()) {
    delay(10);
  }
  int distance = sensor.getDistance();
  sensor.clearInterrupt();
  sensor.stopRanging();

  currentTime = millis();
  sensorReading = distance;

  tx_estring_value.clear();
  tx_estring_value.append((int)currentTime);
  tx_estring_value.append(":");
  tx_estring_value.append(sensorReading);
  tx_characteristic_string.writeValue(tx_estring_value.c_str());
}
This code is then called in the loop() of the Lab 2 example Arduino code, where the sensor is initialized in setup(). On the Python side, I can collect data in a Jupyter notebook:
# Set up Artemis BLE
from ble import get_ble_controller
from base_ble import LOG
from cmd_types import CMD
import time
import numpy as np
import matplotlib.pyplot as plt

LOG.propagate = False
ble = get_ble_controller()
ble.connect()

data = []

# Record received string notifications
def handle_recv_str(uuid, val):
  global data
  data.append(val)

# Collect the data
ble.start_notify(ble.uuid['RX_STRING'], handle_recv_str)
time.sleep(3)
ble.stop_notify(ble.uuid['RX_STRING'])

# Decode and parse
new_data = [n.decode() for n in data]
times = []
distances = []
for d in new_data:
  s = d.split(":")
  times.append(int(s[0]))
  distances.append(int(s[1]))

# Print for good measure, and use this data to plot
print(f"Time (ms): {times}")
print(f"Distance (mm): {distances}")
Test 1: Dimensions
- 18 cm long
- 14.2 cm wide
- 8 cm tall
- 8 cm wheel diameter
- 518 gram weight
- including the car and its 850 mAh battery only
- 553 gram weight with Artemis, sensors, and Artemis battery
I also worked with Linda Li (view her site here) for other measurments, and her mesurements were similar:
- 18 cm long
- 14.2 cm wide
- 8 cm tall
- 14.2 cm chassis length
- 7.3 cm chassis width
- 5 cm chassis height
Test 2: Battery Properties
I spun the robot around continuously on a fully-charged battery, and it took 4 minutes and 35 seconds for it to stop moving.
The battery was noticibly warmer to the touch after this test.
I also tried seeing how long it would take to charge the battery, and it took over 1 hour and 30 minutes to charge completely. This means lab testing done outside of the lab should be planned with care, as the battery will take a long time to charge.
Once again, I worked with Linda to get more measurements in case my own battery was different. Her battery took 8 minutes and 11 seconds for the robot to stop spinning, which means that either my battery wasn’t fully charged or its capacity had already degraded compared to hers. She also had the experience of the battery taking a very long time to charge.
Test 3: Speed
I wrote this in a Jupyter notebook:
Import Requirements
import numpy as np
import matplotlib.pyplot as plt
Speed Tests
Procedure
- Mount the Time of Flight sensor mounted to a bumper (I used tape) and ensure you can get sensor readings from Bluetooth
- Place the car at one end of the hallway and run data collection to make sure you can see the end of the hall (3000+ mm)
- While collecting data, run the car as fast as you can towards the other end of the hall while avoiding crashes.
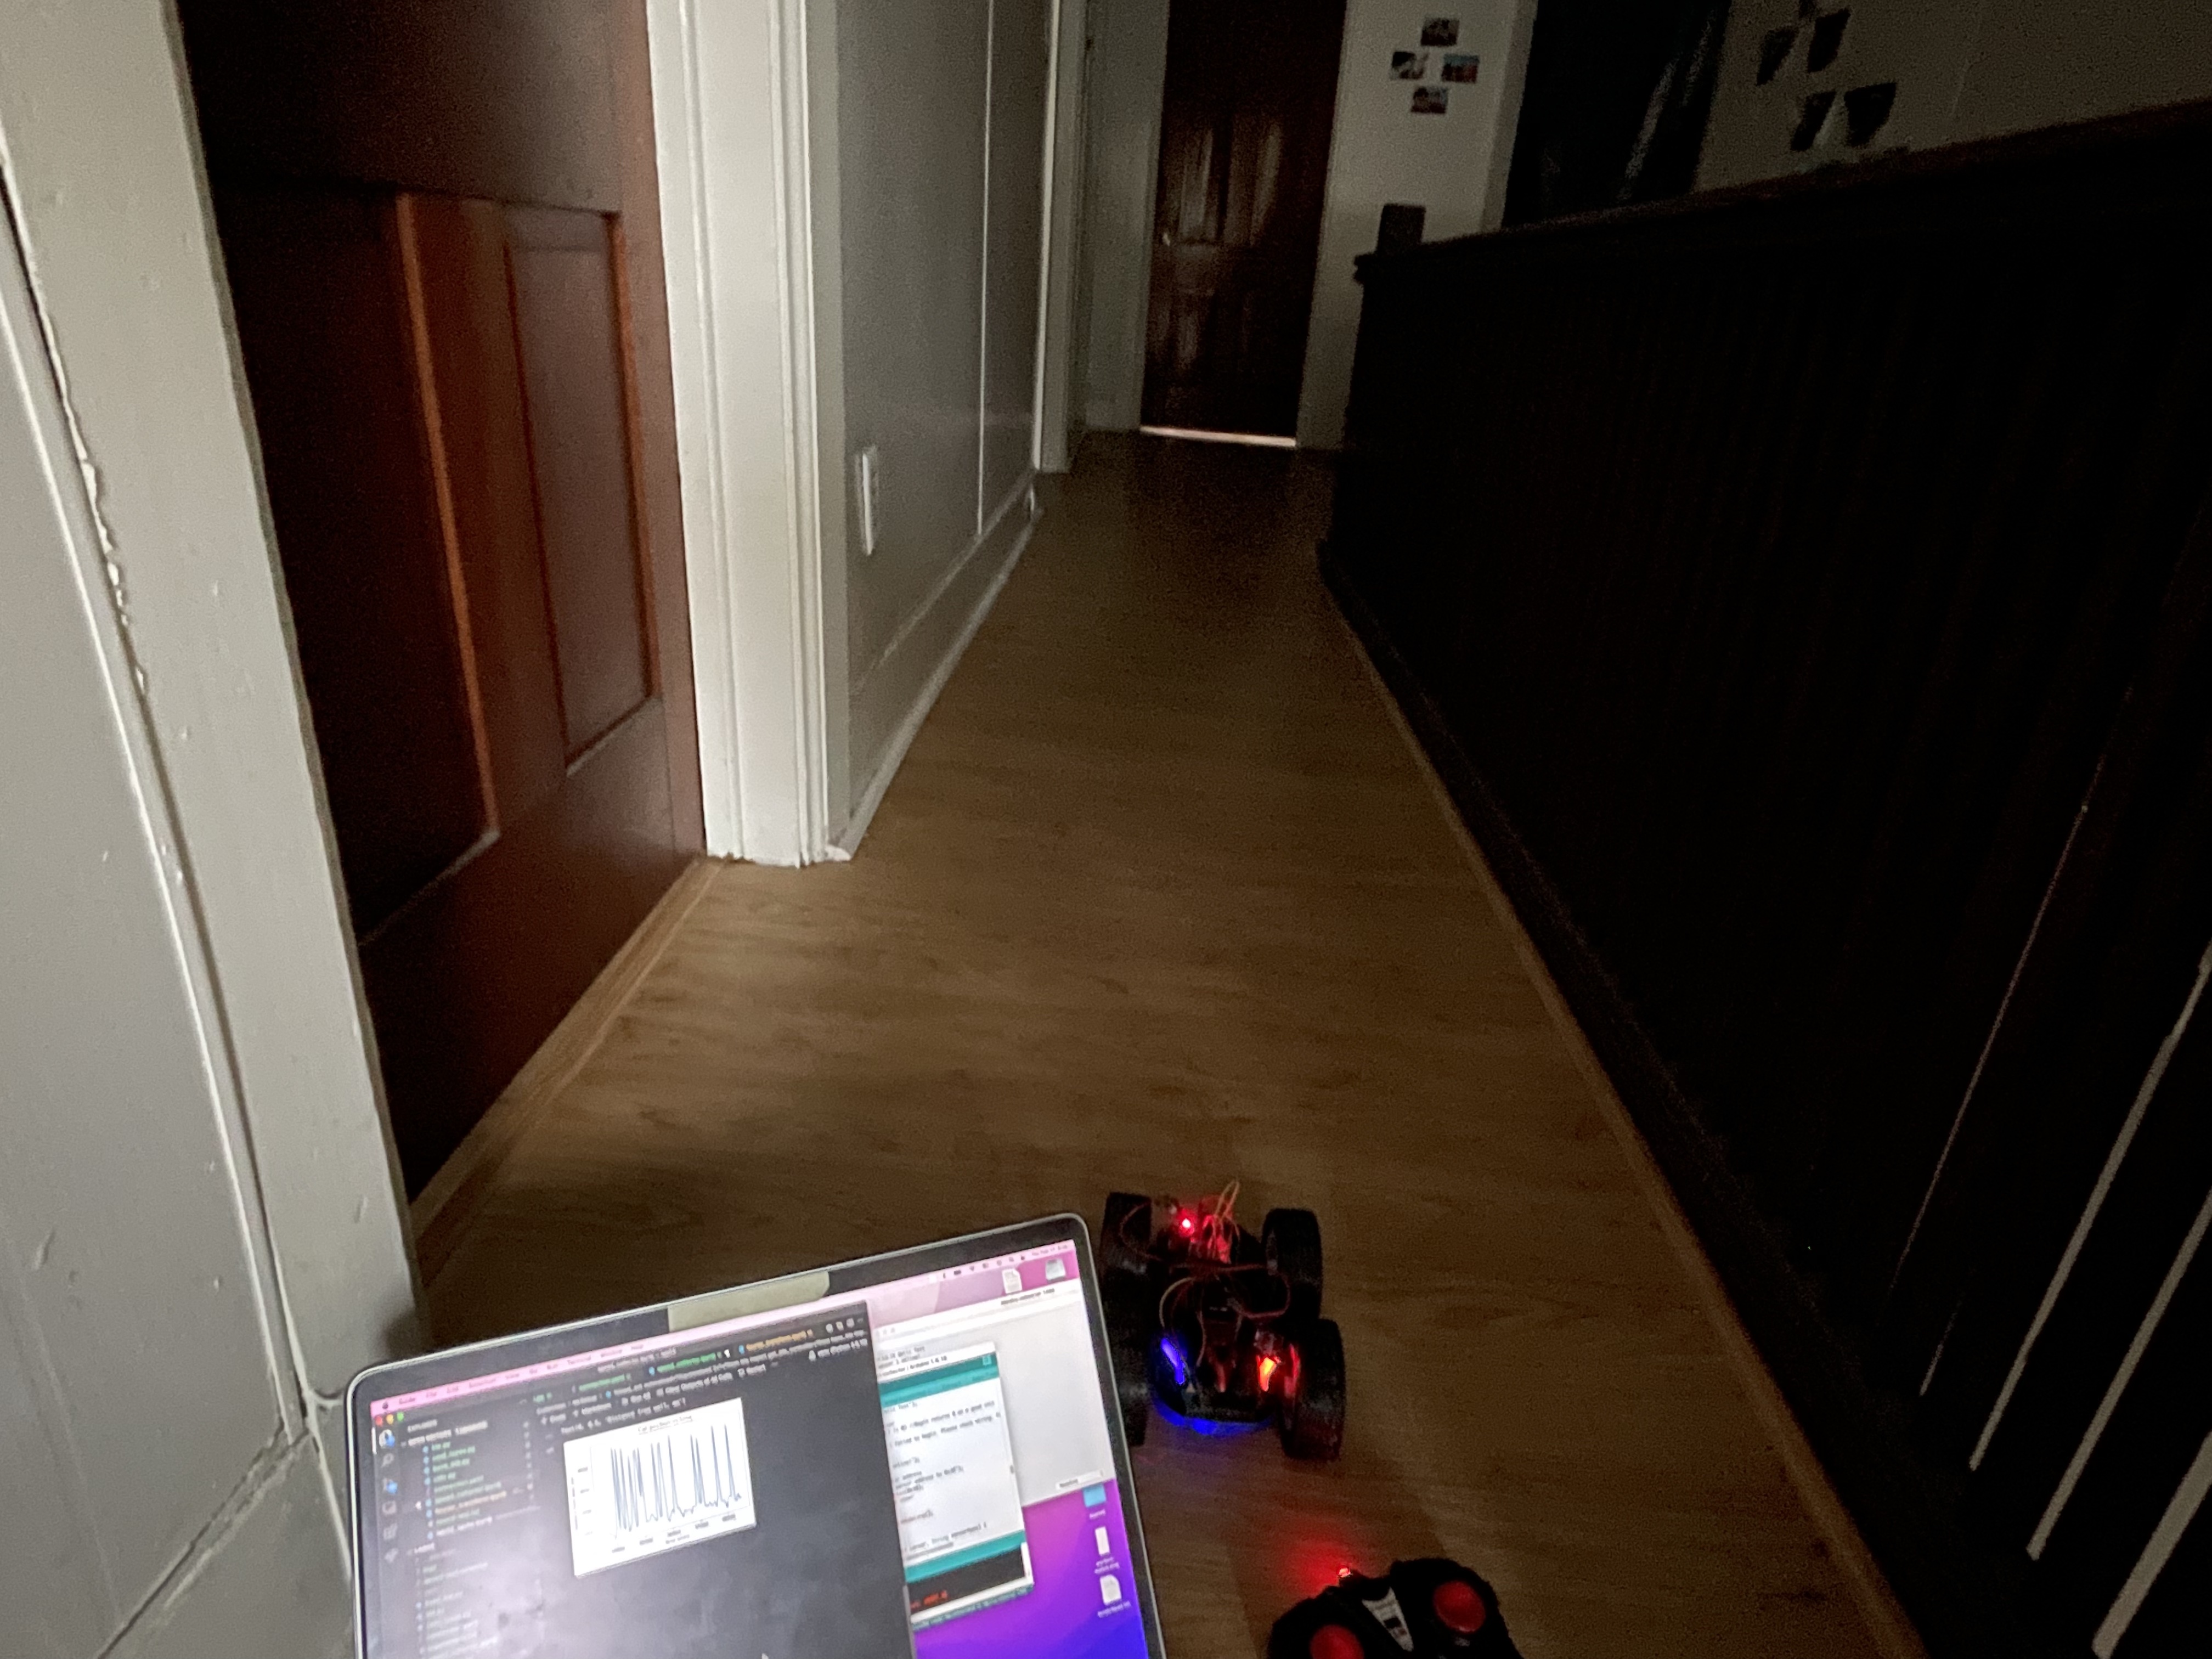
The test track
Data
speed_tests = [
  {
    "time": [101676, 101774, 101880, 101976, 102073, 102177, 102228, 102333, 102385, 102483, 102579, 102684, 102782, 102879, 102986, 103081, 103187, 103283, 103391, 103485, 103589, 103684, 103789, 103883, 103991, 104078, 104176, 104282, 104380, 104484, 104582],
    "distance": [3579, 3574, 3573, 3578, 3549, 4089, 5215, 11, 4794, 105, 63, 85, 60, 26, 32, 31, 24, 3510, 773, 299, 466, 1285, 786, 944, 681, 711, 149, 63, 61, 62, 68]
  },
  {
    "time": [225453, 225560, 225647, 225753, 225848, 225945, 226051, 226146, 226244, 226340, 226444, 226542, 226648, 226743, 226848, 226941, 227048, 227142, 227239, 227337, 227442, 227535, 227642, 227736, 227834, 227939, 228032, 228138, 228234, 228339],
    "distance": [3633, 3607, 3611, 3628, 3642, 3619, 3633, 3675, 3703, 3662, 3682, 3682, 3670, 3738, 3665, 3529, 3262, 2888, 2570, 2267, 1935, 1547, 1258, 555, 194, 290, 339, 385, 416, 430]
  },
  {
    "time": [318899, 318992, 319096, 319194, 319290, 319395, 319491, 319597, 319691, 319795, 319889, 319995, 320088, 320192, 320289, 320387, 320483, 320587, 320681, 320787, 320882, 320987, 321083, 321190, 321284, 321382, 321479, 321583, 321677, 321783],
    "distance": [3559, 3557, 3566, 3563, 3541, 3653, 3547, 3588, 3622, 3631, 3665, 3651, 3688, 3761, 3691, 3618, 3515, 3483, 3276, 2998, 2928, 2741, 2595, 2454, 2328, 2189, 2056, 1912, 1768, 1654]
  },
  {
    "time": [393221, 393318, 393425, 393520, 393625, 393719, 393826, 393923, 394027, 394125, 394222, 394329, 394424, 394530, 394626, 394731, 394828, 394926, 395022, 395120, 395226, 395319, 395424, 395518, 395622, 395717, 395814, 395918, 396013, 396111],
    "distance": [3608, 3622, 3625, 3626, 3610, 3561, 3615, 3704, 3507, 3582, 3513, 3588, 3541, 3689, 3620, 3469, 3323, 3142, 2912, 2704, 2403, 2289, 2137, 1933, 1663, 1391, 840, 638, 500, 424]
  }
]

for run in speed_tests:
  run["time"] = [x - run["time"][0] for x in run["time"]]
Plot
for run in speed_tests:
  plt.plot(run["time"], run["distance"])
  plt.title("Car Position vs Time")
  plt.xlabel("Time [ms]")
  plt.ylabel("Distance Sensor Reading [mm]")
Brake Test
Procedure
- Mount the Time of Flight sensor mounted to a bumper (I used tape) and ensure you can get sensor readings from Bluetooth
- Place the car at one end of the hallway and run data collection to make sure you can see a distance that is reasonably far (at least 1000 mm)
- While collecting data, run the car into the wall, but try to stop before you hit it by pressing the button on the remote in reverse of the direction the car is traveling.
Data
brake_tests = [
  {
    "time": [527589, 527686, 527792, 527889, 527993, 528089, 528196, 528290, 528396, 528493, 528590, 528694, 528792, 528889, 528987, 529091, 529187, 529291, 529384, 529488, 529581, 529685, 529778, 529882, 529975, 530079, 530172, 530277, 530375, 530479],
    "distance": [3469, 3476, 3466, 3477, 3473, 3367, 3374, 3269, 2139, 1590, 1174, 741, 349, 187, 137, 119, 168, 203, 259, 287, 298, 298, 300, 298, 298, 297, 299, 301, 300, 300]
  },
  {
    "time": [556317, 556411, 556509, 556606, 556711, 556807, 556913, 557007, 557113, 557207, 557304, 557410, 557504, 557610, 557704, 557812, 557906, 558010, 558103, 558207, 558300, 558404, 558497, 558604, 558700, 558804, 558900, 559004, 559100, 559204],
    "distance": [3313, 3313, 3322, 3307, 3317, 3323, 3306, 3324, 3256, 2672, 1844, 1364, 874, 506, 422, 447, 715, 710, 848, 794, 788, 782, 784, 786, 787, 783, 787, 782, 782, 780]
  }
]
# Subtract off the initial time so everything starts at 0 ms
for run in brake_tests:
  run["time"] = [x - run["time"][0] for x in run["time"]]
Plot
for run in brake_tests:
  plt.plot(run["time"], run["distance"])
  plt.title("Brake Test: Car Position vs Time")
  plt.xlabel("Time [ms]")
  plt.ylabel("Distance Sensor Reading [mm]")
Conclusions
From the speed tests:
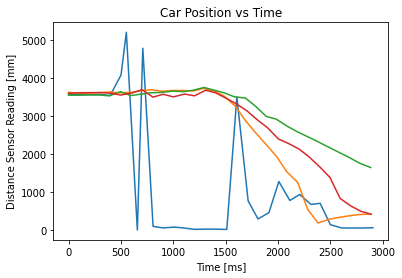
- The car starts at 3600 mm and goes to 430 or 1650 mm in 1500 ms (discounting the blue run for noise), which equates to 1.3 to 2.1 meters per second.
- The large range is due to how the car may not have been operating at full speed during all runs, as the battery was at a near-full charge when these runs were executed.
- The measurements may not be perfect due to how the test track has a finite length, and the car drifts right (as seen from the reaas it moves forward. Since
From the brake tests:
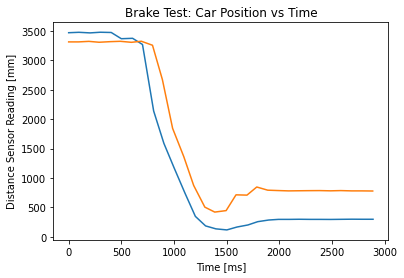
- The car starts at 3310 mm and goes to 300 mm in 1203 ms (blue) or or 780 mm in 1187 ms, which equates to 2.1 to 2.5 meters per second.
- The end position for speed is measured at the end of the graph and not the minimum, as the car would tilt forward (angling the time-of-flight sensor at the floor) in order to stop.
- It takes about 750 ms to come to a full stop. This is counted from the time of minimum distance to the time the readings stabilize.
Test 4: Stunts
I found out that one can make the car flip by driving quickly in one direction and then suddenly commanding the car to go the opposite direction.
- The friction of the wheels is large enough that it works on both relatively-smooth surfaces (like the lab classroom’s tiling) and rougher ones (like the lecture classroom’s carpet)
- The car flips more slowly as it is driven more, so the battery is definitely a factor in which stunts one can do
- While trying to make this happen, I found out that driving the car with the remote has a limited amount of precision. It was difficult to get the car to stop immediately without making it begin to flip over itself, and the turning felt jerky and uncontrolled.